SpenDB, a data analysis tool for government finance, looking for testers!
30 June 2015
Earlier this month, I wrote about the prototype of SpenDB, a light-weight analytical tool for government financial data. After nearly a month of work, the tool has now matured into a beta release, ready for thorough testing with your data!
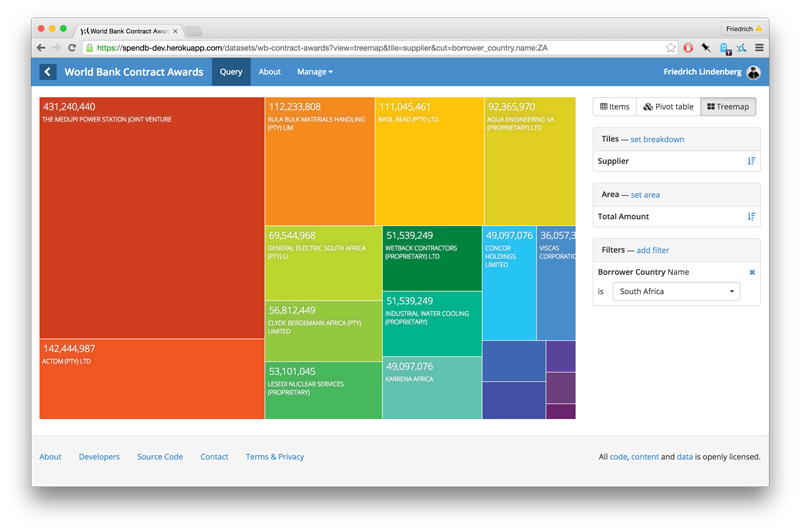
The two most obvious changes are the re-designed user interface with a much simpler and quicker data import workflow, as well as the inclusion of angular-cubes, a simple query tool that can be used to browse data in pivot tables and treemaps. I’m hoping to add further visualisation types, like bar charts, line graphs or sankey diagrams in the near future.
This makes it easy to upload a CSV or Excel file, validate its contents, model the data and then run some rudimentary analysis within minutes. It also means the API to drive third-party applications is now well-tested and stable, as today it will begin to be used by OffenerHaushalt as it’s backend.
Unlike OpenSpending, I don’t expect SpenDB to be used only as a hosted service. The tool is easy to install and can be customized and used for parts. If you’re interested working with the project - as a user or contributor, give me a shout or join the Gitter chat.
Finally, for the more technically inclined, a more thorough list of major changes:
- Switched the frontend from server-side templates to a stand-along Angular application. This is beginning to turn into a stand-alone package, thanks to Mila.
- Improved data validation and source data analysis, compliant with JSON Table Schema.
- Built and included angular-cubes to run simple data anlaysis on each fully loaded dataset.
- Direct-to-S3 uploads from the user interface to allow for stable uploads of up to 5G source data.
- Split out dataset reference data into a separate package, fiscalmodel.
- Simplified the asset builder and the client-side caching subsystem.
With all of this infrastructure work done, I’m hoping for the next steps of this development to relate more closely to specific datasets. This includes extending the functionality of OffenerHaushalt, but also making more granular datasets, like the Förderkatalog accessible.
Finally, I want to tackle the big one: OpenTED, which currently exists mainly as a collection of CSV files, will hopefully gain an accessible query interface so that journalists and researchers can more easily approach it.
Obviously, I’d love to learn more about how other users would want to see the tool evolve, and to accept any pull requests and changes!

