
Twindle: lessons learned from data mining Twitter
12 September 2013
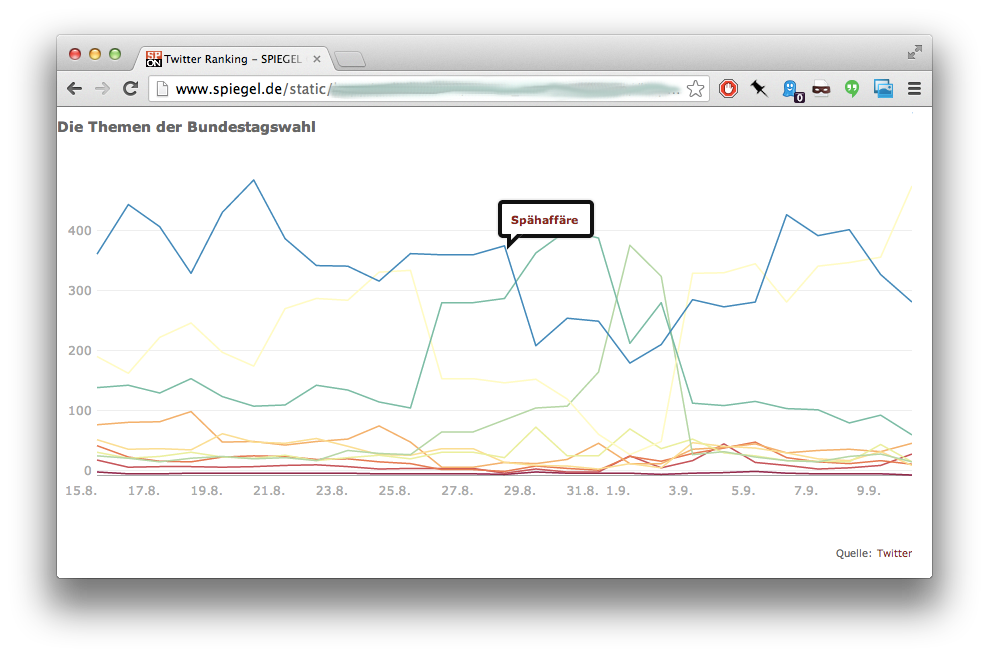
Twitter is the new voxpop: a quick way for news organisations to show what the people think, without the actual hassle of talking to any. Over the last few months, I’ve spent some time recording a subset of German Twitter traffic as a way to track public engagement on political issues during the current campaign season. While the resulting application didn’t end up getting launched in time for the elections next week, the process of building the necessary tools was a great learning experience. In this post, I want to take a look at the lessons we’ve learned about tracking the Twitter status stream.
Our tool: twindle
When we started the project, I was convinced that there would be some off-the-shelf toolkit for grabbing and storing data off the streaming API. But while there are plenty of library bindings for different programming languages, we didn’t find a ready-made script to store the data. That’s why we’re thrilled to release twindle, the tracking software we’ve built, as an open source set of tools.
Using twindle is simple: editors can enter search terms into a Google Docs spreadsheet, and a few moments later the software will incorporate these new searches into its configuration and begin tracking all related messages.
The core software behind this is based on node.js, as an asynchronous system seemed a good match for the streaming service (although, eventually, node did crash at one point, losing over 4.5mn unstored status messages). Our analytics tools, on the other hand, are based on Python, which ensures easy re-use of a wide range of machine learning libraries. Statuses themselves are stored in a Postgres database, while bundled copies of the recorded data are uploaded to S3 for batch analysis. Violating the golden hipster developer rule (“social media data can only survive in NoSQL technology no older than six months”) has given us a lot of flexibility to quickly test a query, while still processing a few hundred thousand statuses every day without major issues.
After going through a couple of iterations, twindle is now performing reliably and quickly. Still, the streaming API is an odd thing, and we’ve had to learn a few lessons on our way.
Lesson 1: Build a dragnet
As we started, our plan was to focus on keyword tracking - essentially curating a wide range of topical searches which we would monitor. While this produces a good signal/noise ratio, it also results in virtually zero ability to detect upcoming trends organically or to backtrack on an emergent topic.
At DataHarvest, Gavin Sheridan of Storyful offered their solution to this problem: building a dragnet. After initiating a few keyword searches, a tool can identify multipliers and track them directly.
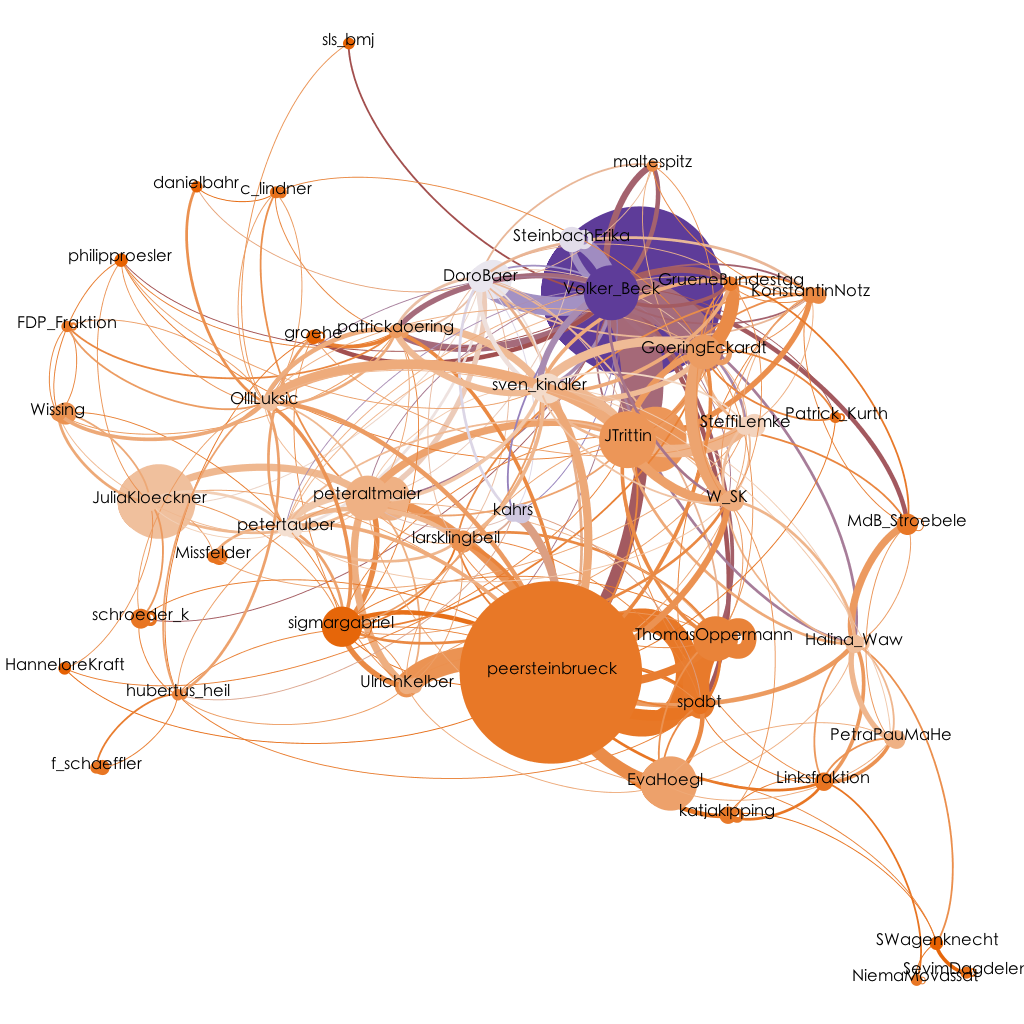
To that end, twindle will score users by how many of their messages have been relevant to our keyword searches and follow all future updates of those who score highly on this metric. This way, we are identifying a dynamic group of about 80,000 users who become a survey panel in addition to any pre-defined search terms.
Lesson 2: Count your retweets
This one should be obvious, but it really didn’t occur to me before it had cost us two weeks worth of data. Since the streaming API forwards messages at the precise moment when they are created, their retweet count will always be zero. In order to identify retweets one therefore has to count them by hand via a field which is only set for retweeted messages. I’m fairly sure that this method will not yield a perfect retweet count, however, although a few samples I’ve taken have been accurate.
Lesson 3: Store in a bucket
The conversion from Twitter’s JSON format into our relational data schema is somewhat lossy, so we decided to also keep a copy of the original format. While we initially stored this in the database, the additional data put unnecessary strain on the server.
Uploading bundles of tweets to S3 as plain files reduced that pressure while establishing a flexible archive. The S3 bucket holding this data can be accessed directly through Elastic Map Reduce jobs, giving us a secondary data mining mechanism capable of large-scale aggregation.
Lesson 4: Queue up
After Twitter kindly granted us elevated access to their API in mid-June, the initial node.js application became less responsive. Since not loosing any messages is a priority, we uncoupled the stream reader from the database backend through a message queue, creating an additional buffer in between the two layers. This solution has worked great and also allows us to tune and restart the database without missing out on any data.
Lesson 5: Make sense of it all
Twitter data in itself is incredibly messy. Even with keyword and language filters, most tweets will still be about someone’s cat, food or just random spam. One man’s hashtag for a liberal party is another’s scathing insult.
Twindle includes a set of analytical scripts which help to classify, geocode and aggregate the collected messages. These are fairly simple for now, but we’re hoping to prop them up and to include patches from other people as the project evolves.
Developing a community-driven set of easy-to-use, well-documented and well-tested data mining scripts for Twitter would make a great resource. The evolved Twitter API may be tricky and full of subtle issues, but running queries against the collected data should be fun and productive.
This makes twindle an invitation to collaborators. We’d love to see further scripts and tools added to the code base and to hear about other people’s use cases and deployments.