OpenInterests.eu: relating lobbying, expert groups and public finance in the European Union
28 January 2014
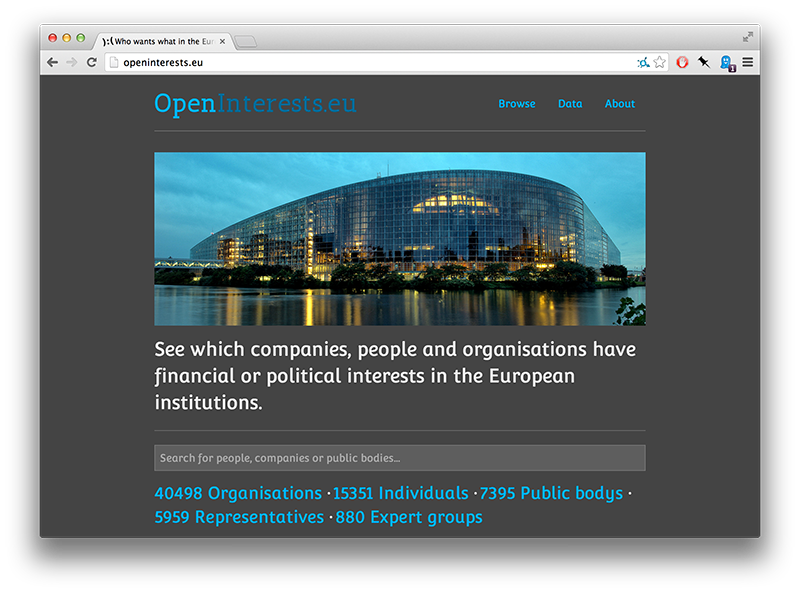
During last weekend’s #EPhack in Brussels, I built a minimalistic frontend for OpenInterests.eu. The site lets everyone explore which people, companies and institutions have political or financial interests in decisions of the European Union institutions.

What is it good for?
While it’s still an early prototype, my hope is to offer accessible briefing pages on individual actors, find surprising overlaps between different categories of activities (such as lobbyists which are part of expert groups), and offer summary reports about financial beneficiaries of EU procurement, lobbying activity and expert group consultations.
In some ways, the site brings together three projects that I’ve been involved in over the past three years: a (still unreleased) effort to build a more accessible version of the EU lobby register; an analysis of the Commission’s direct expenditure (FTS) we did as part of OpenSpending; and the contract awards data we extracted as part of OpenTED. Each of these datasets would make for an excellent news application on their own. By combining them, I hope to discover a type of serendipitous overlap that would reveal real-life interactions.
A possible concern with this approach is that I would need to consider yet another aspect for the picture to be fully relevant (e.g. find data on the ways in which organisations involved in lobbying benefit from EU policy).
While that’s always going to be true, having some basic information about actors and their relations available makes for a good research tool. Of course, I hope to integrate new sources of information, such as the MEPs declarations of financial interest. But the result will never be a complete picture of influence in a complex environment like Brussels.
How it works
Most of the work behind OpenInterests.eu is focussed on data extraction: the application includes a set of scrapers for the EC/EP register of interests, register of expert groups, the EC’s financial transparency system and TED, the joint European procurement system.
Once the data has been extracted, it gets loaded into a common database where some cleaning is performed as well as geo-coding and, soon, reconciliation with OpenCorporates. What comes out of this process is still fairly messy, though - and we’re going to need editorial work to fix the data eventually.
The application itself is powered by grano, my everlasting code name for a social network analysis tool. In its current revision, grano provides a graph framework where each actor and relationship are defined by a set of properties. Since we’re combining different data sources, the provenance of each property’s value is tracked individually - turning all ‘facts’ in grano into sourced ‘assertions’.
The web interface of OpenInterests.eu sits on top of this graph, providing a bespoke interface for the EU datasets. In the future, I hope to remove more of the current attribute tables and make the presentation of the information much more specific to the semantics of the data (show maps for geographic information, tables for funding data, and text styled for easy reading).
Whats next?
While there are a lot of potential additional data sources for the OpenInterests.eu graph, my next step has to be to improve the quality of the information that is there. This includes pushing forward the de-duplication of entities (including linking companies to OpenCorporates), providing context and documentation on the data that is included and – perhaps most importantly – a full excerpt of all data in simple formats. Some of the included material - such as four years worth of EU procurement data - aren’t publicly available at all yet.
Following that, I’m hoping to add some basic reporting functions: listing the companies which have received the most in grants, contracts; which organisations are particularly active in expert groups and who has the largest lobbying budget. Additionally, the graph structure will start to provide its own metrics, such as the centrality of directorates and people, or the betweenness of think tanks and industry forums.
All of this is, as usual, overly ambitious but fun to think about. If you want to help make some of this work, get in touch or submit a pull on GitHub :)
